

Opinion: Crypto Market has Bottomed for Q1 (2022)
Opinion: Crypto Market has Bottomed for Q1 (2022)

It has been a painful couple of months for the crypto market as the reflation trade rolled over into a market deleveraging cycle.
This came after the November FOMC meeting where the Federal Reserve announced they would begin tapering its asset purchases by $15 billion each month from its current rate of $120 billion while intending to maintain that rate of reduction on a monthly basis moving forward.
High beta has suffered tremendously after this move from the Fed. Since then, Bitcoin has fallen nearly 40% along with the broad crypto market correcting 30-50% from their highs.
Though, in my opinion, the majority of the selling in crypto market is over and the bottom for the asset class could be in here for Q1.
Further analysis suggests that investors increasingly view that Omicron potentially catalyzing herd immunity for the global economy and effectively ending the pandemic phase of the COVID-19 crisis could be a driver for a Bottom-Up Macro Regime REFLATION (growth: Up / inflation: Up).

The recent poor job numbers that produced the slowest job growth rate in the last 52 weeks could cause the over-crowded inflation regime positioning (growth Down / inflation Up) to roll over.
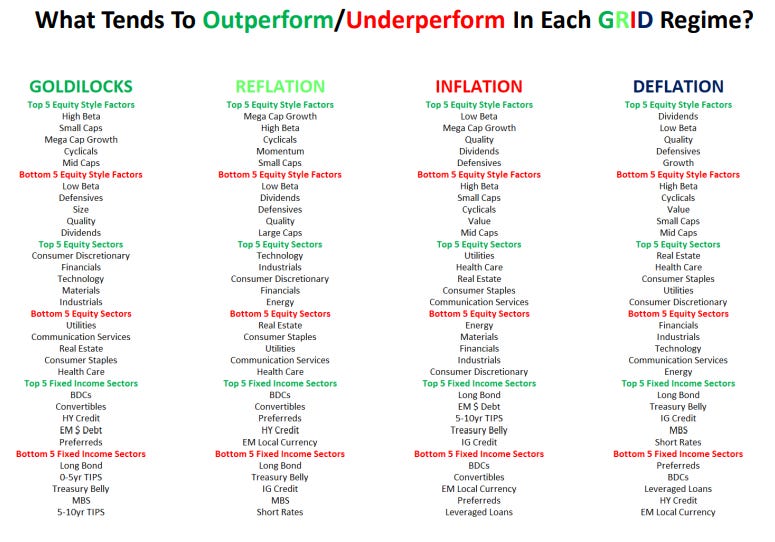
It is important to be adaptive not reactive to changes in the business cycle. The goal is to use impulse changes in the business cycle (growth/inflation data) to front run securities.
After the solid job numbers in the beginning of December, the reflation regime postioning rolled over into an inflation regime, as investors anticipated they were peak job numbers. Utilities, real estate, health care, energy, and low beta have all led since then.
Markets are extremely forward-looking. An example of this is when 10-year yield rose on tapering announcement in 2013 but fell through the ACTUAL tapering process in 2014. This is how markets operate.

Bitcoin has medium-term support at 41,000. Price tested that demand level, broke below it but price quickly reclaimed above 41,000. This is exactly what needed to happen for a potential price reversal to occur.

From a profile view, consecutive low volume-nodes became present on the tape suggesting supply was absorbed under 41,000 showing real deal big buyers stepping in for a potential larger move upwards.

Disclaimer: Charts and analysis are for discussion and education purposes only. I am not a financial advisor, do not give financial advice and am not recommending the buying or selling of any security.